Design & Information Visualization
This section highlights proficiency in Adobe Illustrator, Photoshop, SharePoint, Figma, and Canva for visual communication, user experience (UX) design, data display (Infographics), and conceptual manipulation. It showcases a diverse skillset bridging creative design and technical precision through the development of interactive prototypes, visual assets, complex knowledge architectures, and automated process logic.
Product Strategy & UX Protyping
Entrepreneurial Journalism Pitch Deck
Development of a persuasive, problem-solving pitch deck for a new digital organization tool, Tether. The deck is structured to immediately establish the core problem and present a clear solution for pinning scattered information into cohesive 'threads'. Design focuses on clarity, user pain points, and product vision.
Canva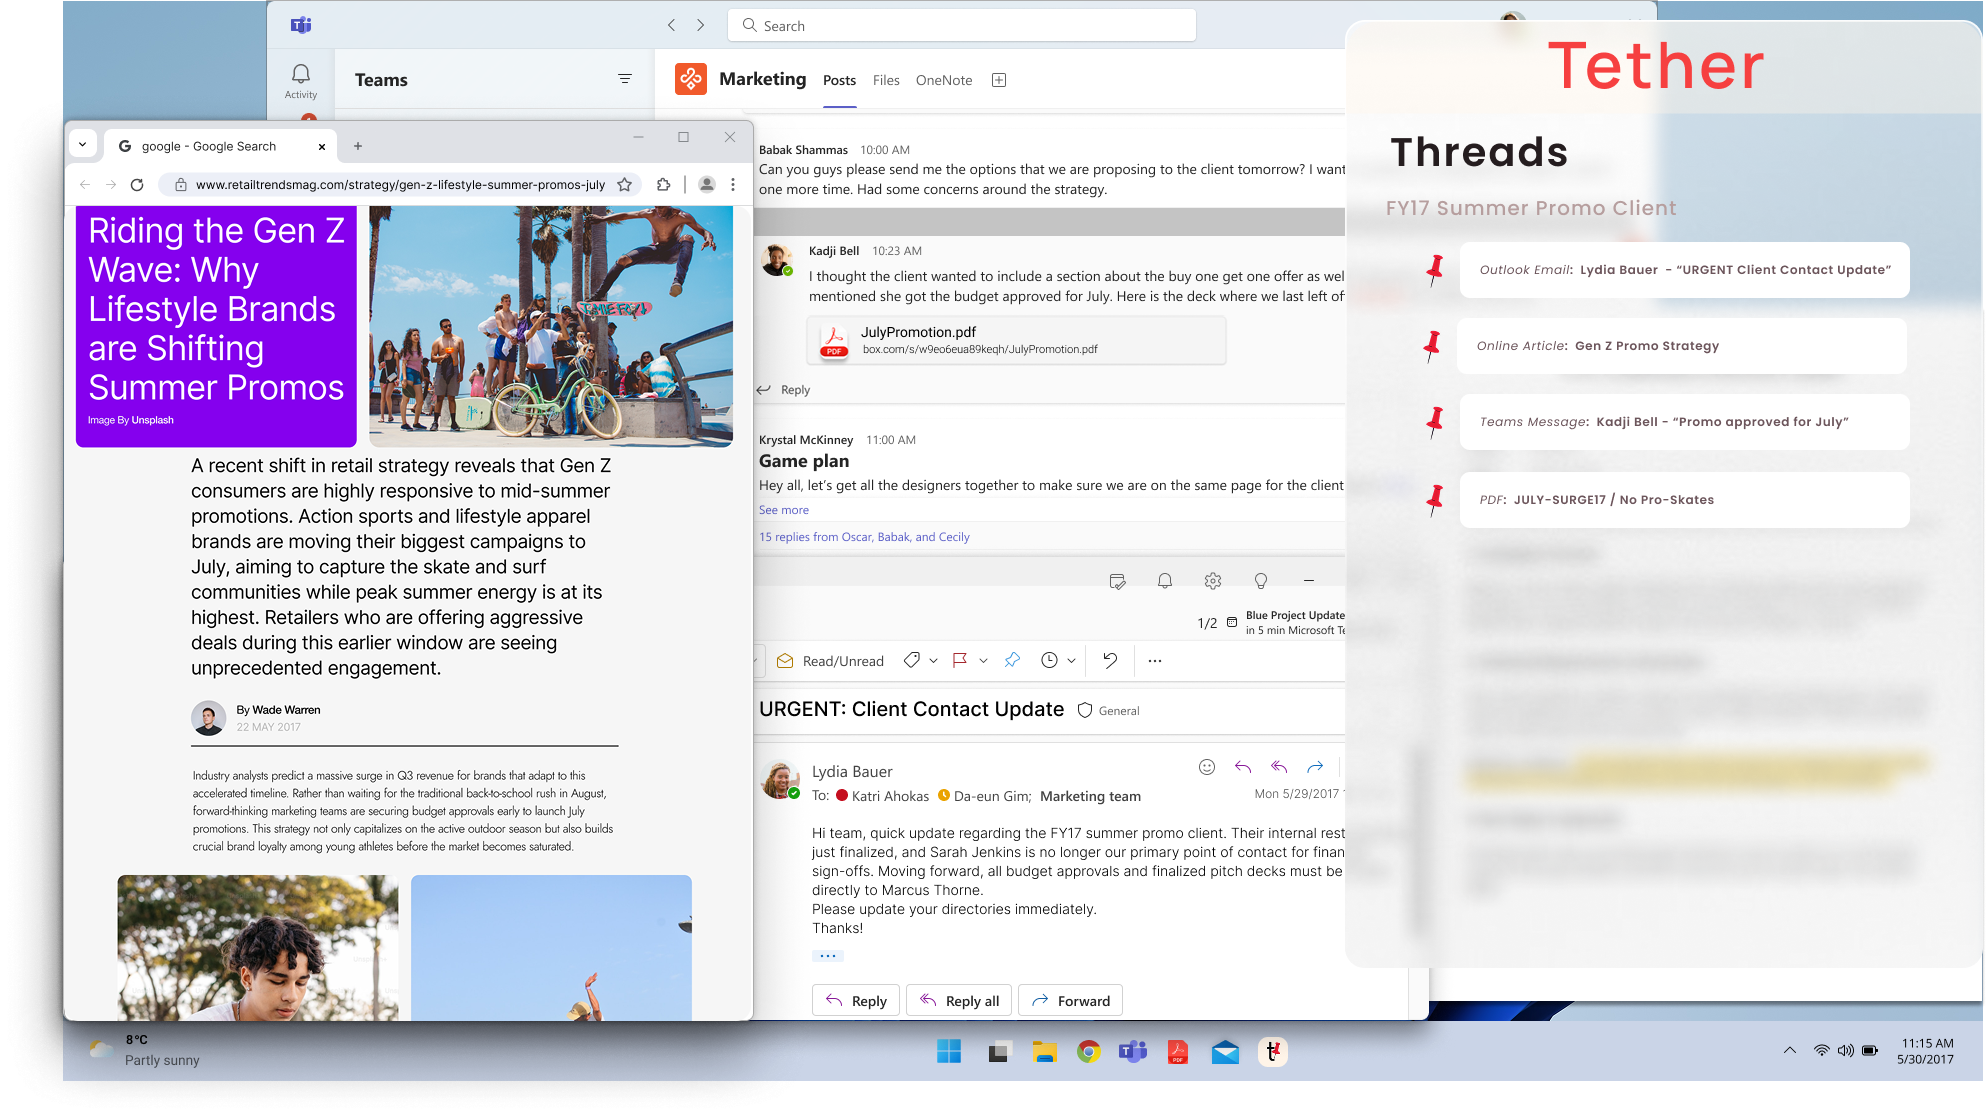
Interactive UX Prototype: Tether Desktop Interface
A fully interactive proof-of-concept for the Tether application. Built entirely in Figma, this prototype demonstrates a user-centric overlay system that pulls scattered digital communications into a single, cohesive workflow. This project highlights my ability to translate strategic problem-solving into a functional UI design, utilizing technical skills learned via LinkedIn Learning, including frame architecture, custom component scaling, and interactive node mapping.
FigmaInformation Science & Visual Assets
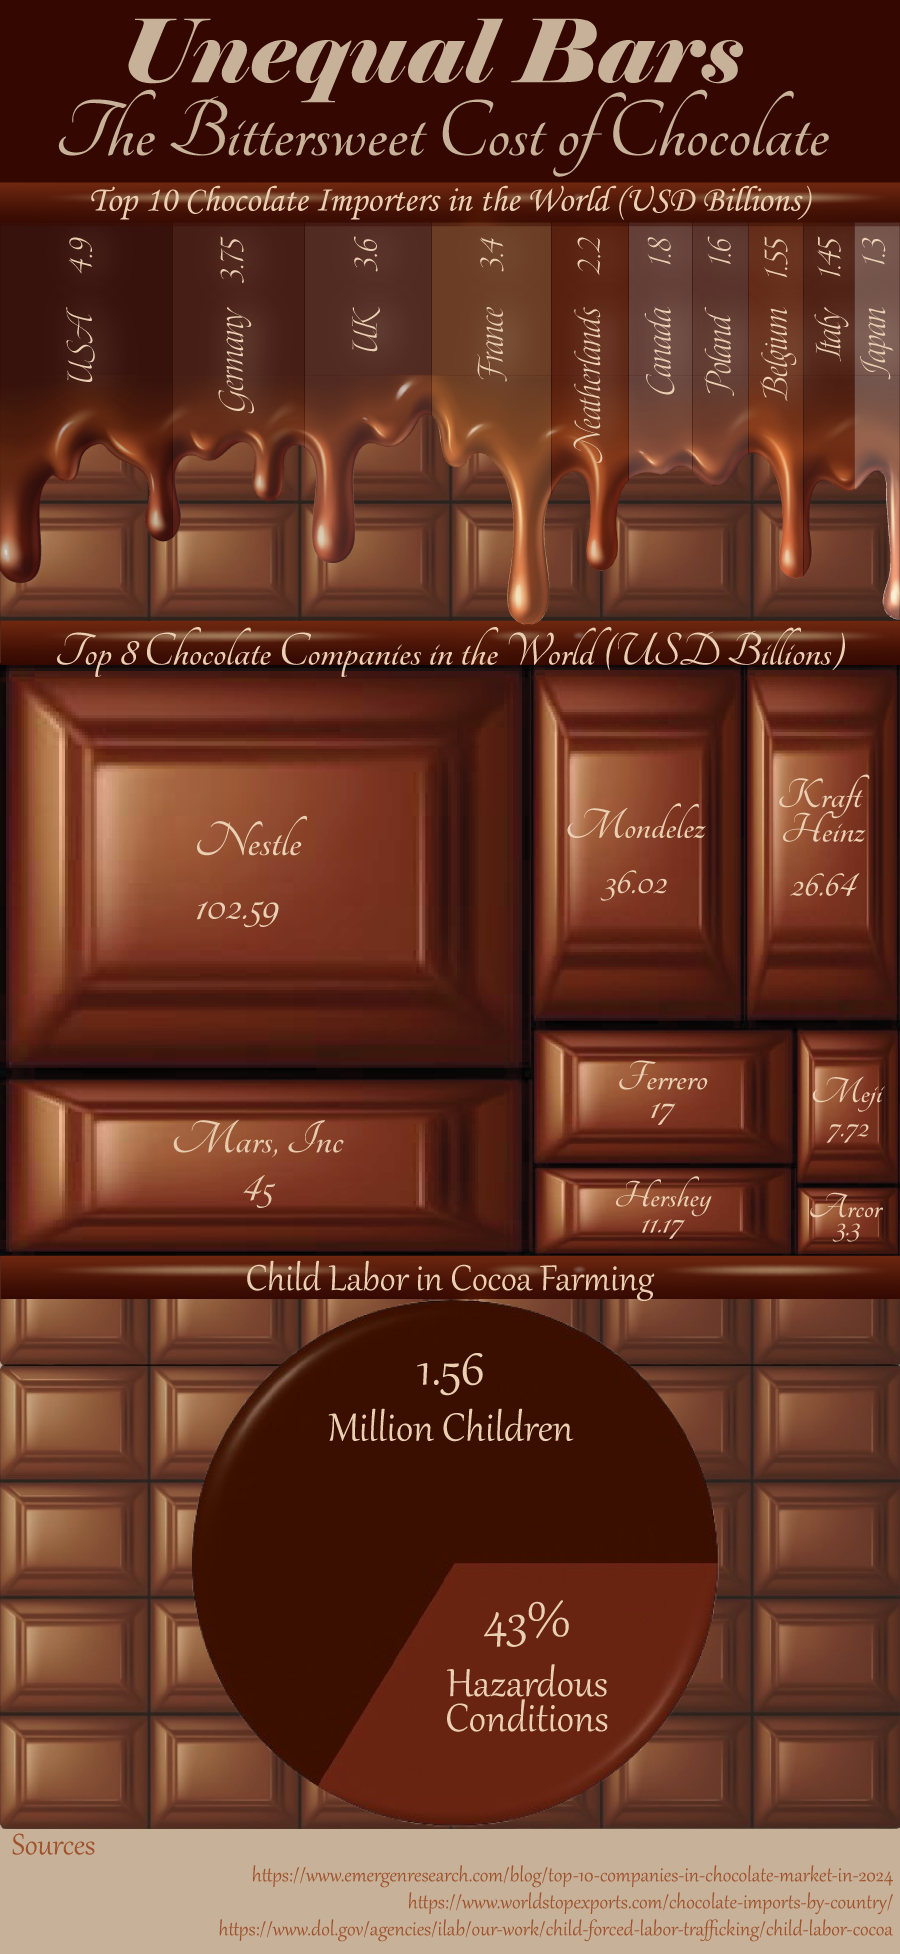
Infographic: Unequal Bars, The Bittersweet Cost of Chocolate
Design and execution of a complex, single-panel infographic to synthesize disconnected global data points. The visualization uses a rich chocolate metaphor to highlight three layers of data: Top Importers, Global Company Market Share, and the sobering reality of Child Labor in cocoa farming.
Illustrator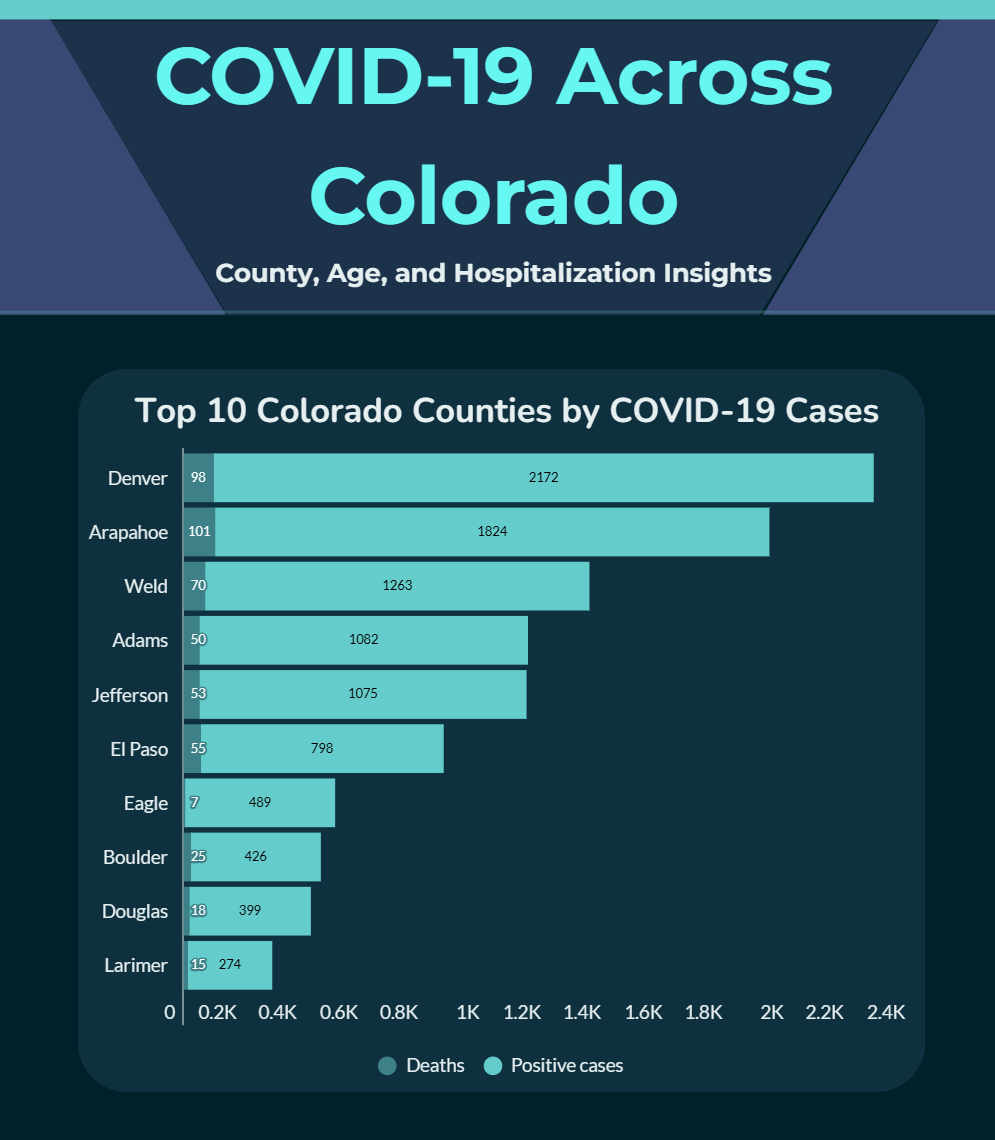
Data Visualization: CO Covid‑19 Interactive Infographic
Project leveraging Infogram to transform a complex dataset into an easily digestible, interactive infographic. Focus was placed on data synthesis and visual hierarchy to clearly present three key data points to the user via dynamic, explorable charts.
Infogram (External Site)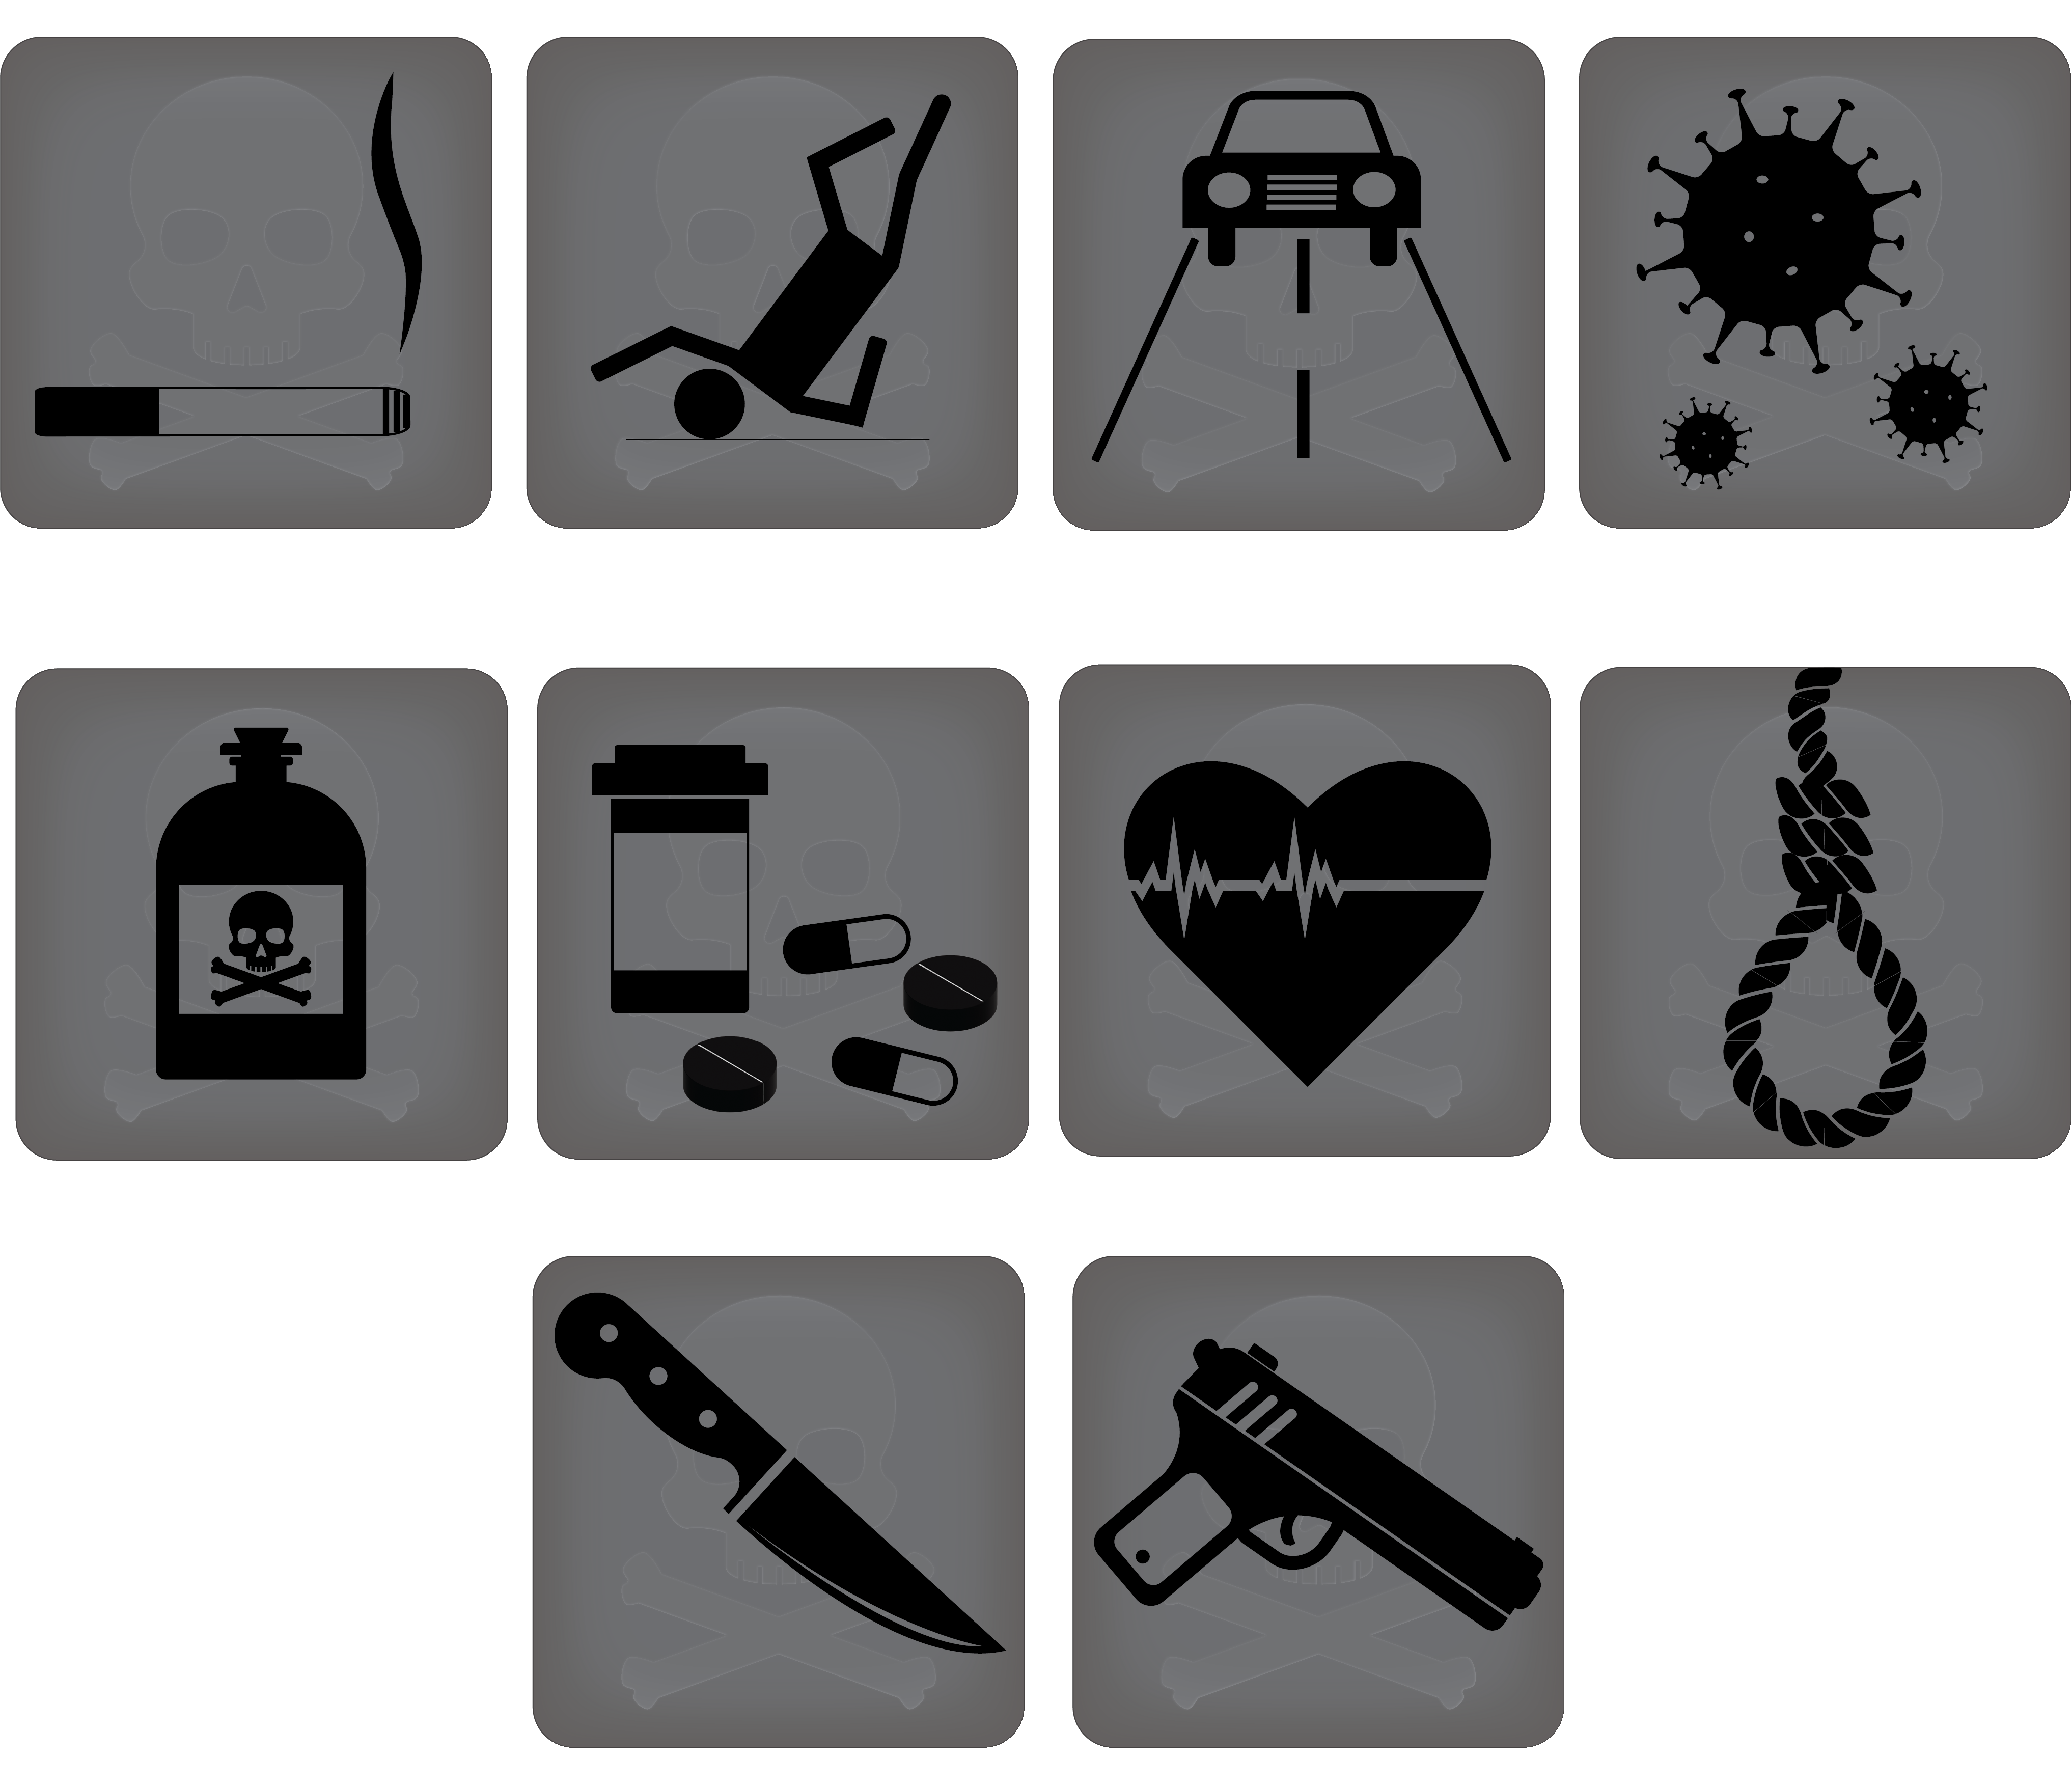
Icon Set: Causes of Death
A design study in iconography and visual clarity, representing causes of death (e.g., drowning, disease, poison) with minimalist, instantly recognizable symbols. The consistent color scheme and skull/crossbones motif ensure thematic unity and high-contrast legibility across the full set.
IllustratorCreative Manipulation & Compositing (Adobe Photoshop)
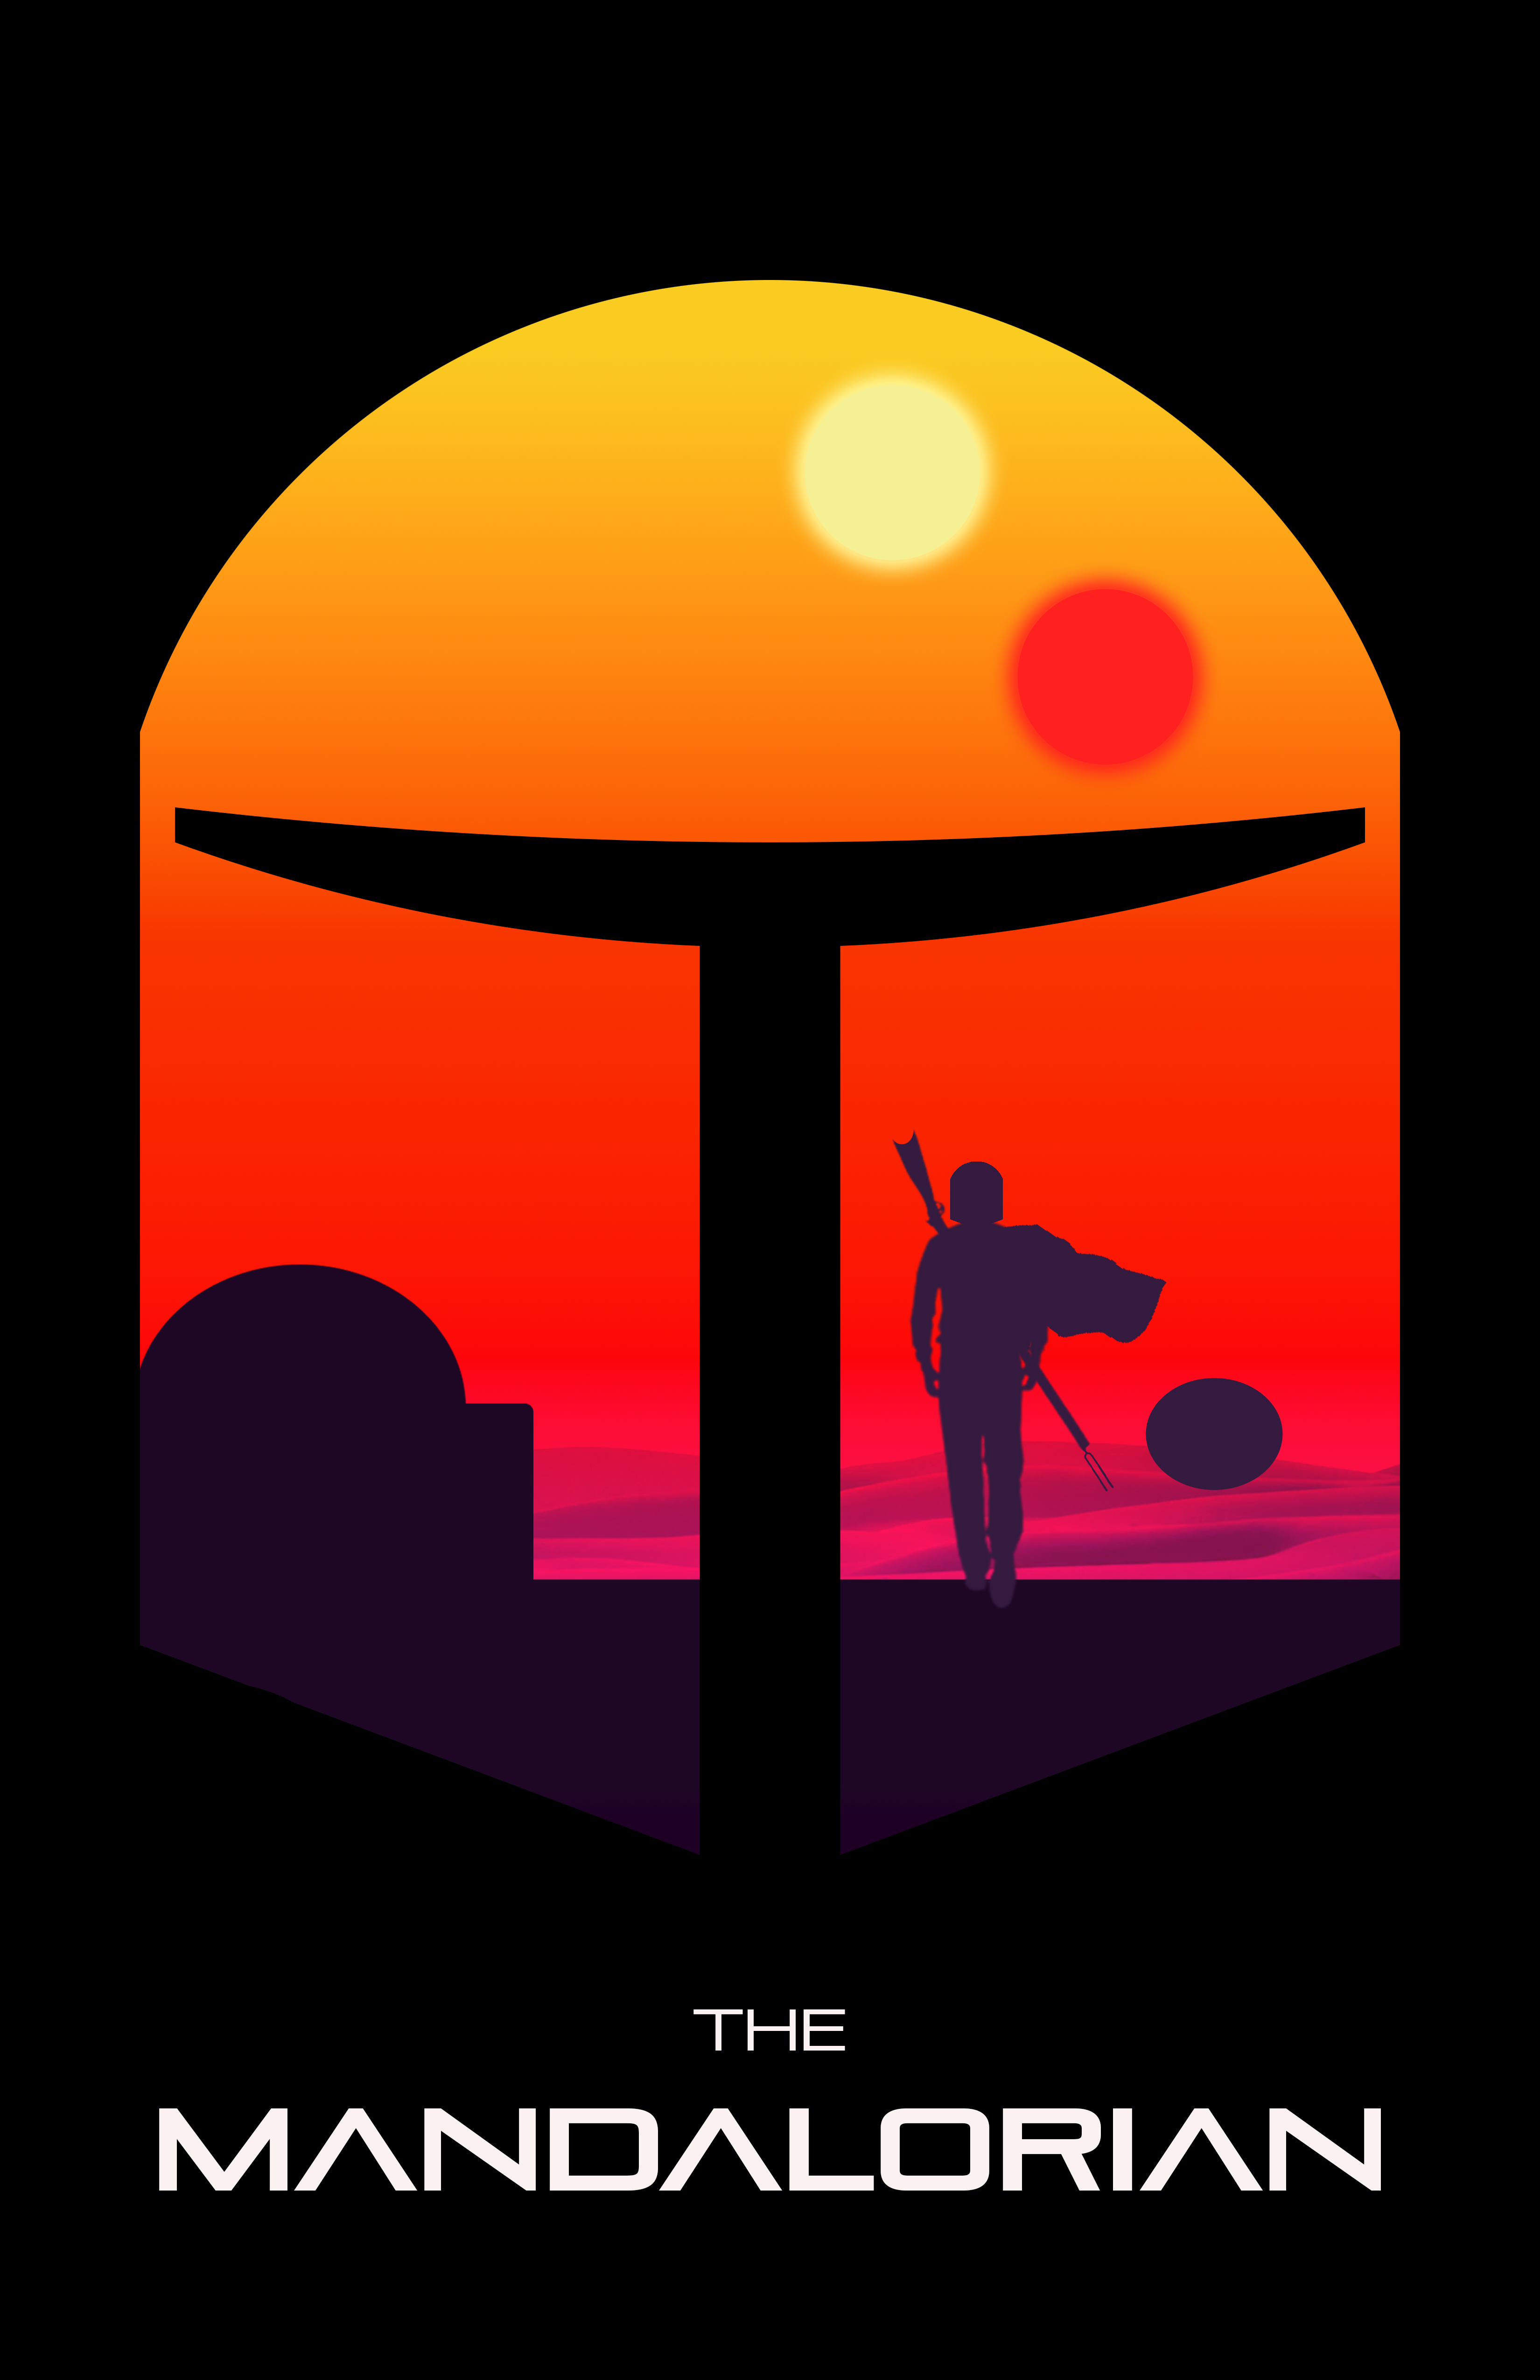
Conceptual Poster: The Mandalorian
Creation of a minimalist poster using vector graphics to capture the essence of a popular cultural property leveraging negative space and a bold, limited color palette to achieve immediate recognition and strong visual impact.
Photoshop
"A Night in the Dreams" Photo Series
A multi-image conceptual series created through complex photomontage and digital manipulation. Each piece layers disparate visual elements (e.g., astronomical environments, Las Vegas landmarks, personal portraits) to explore the relationship between internal dream states and external reality. Focus was placed on seamless blending and atmospheric lighting.
PhotoshopSystems & Information Architecture (SharePoint)
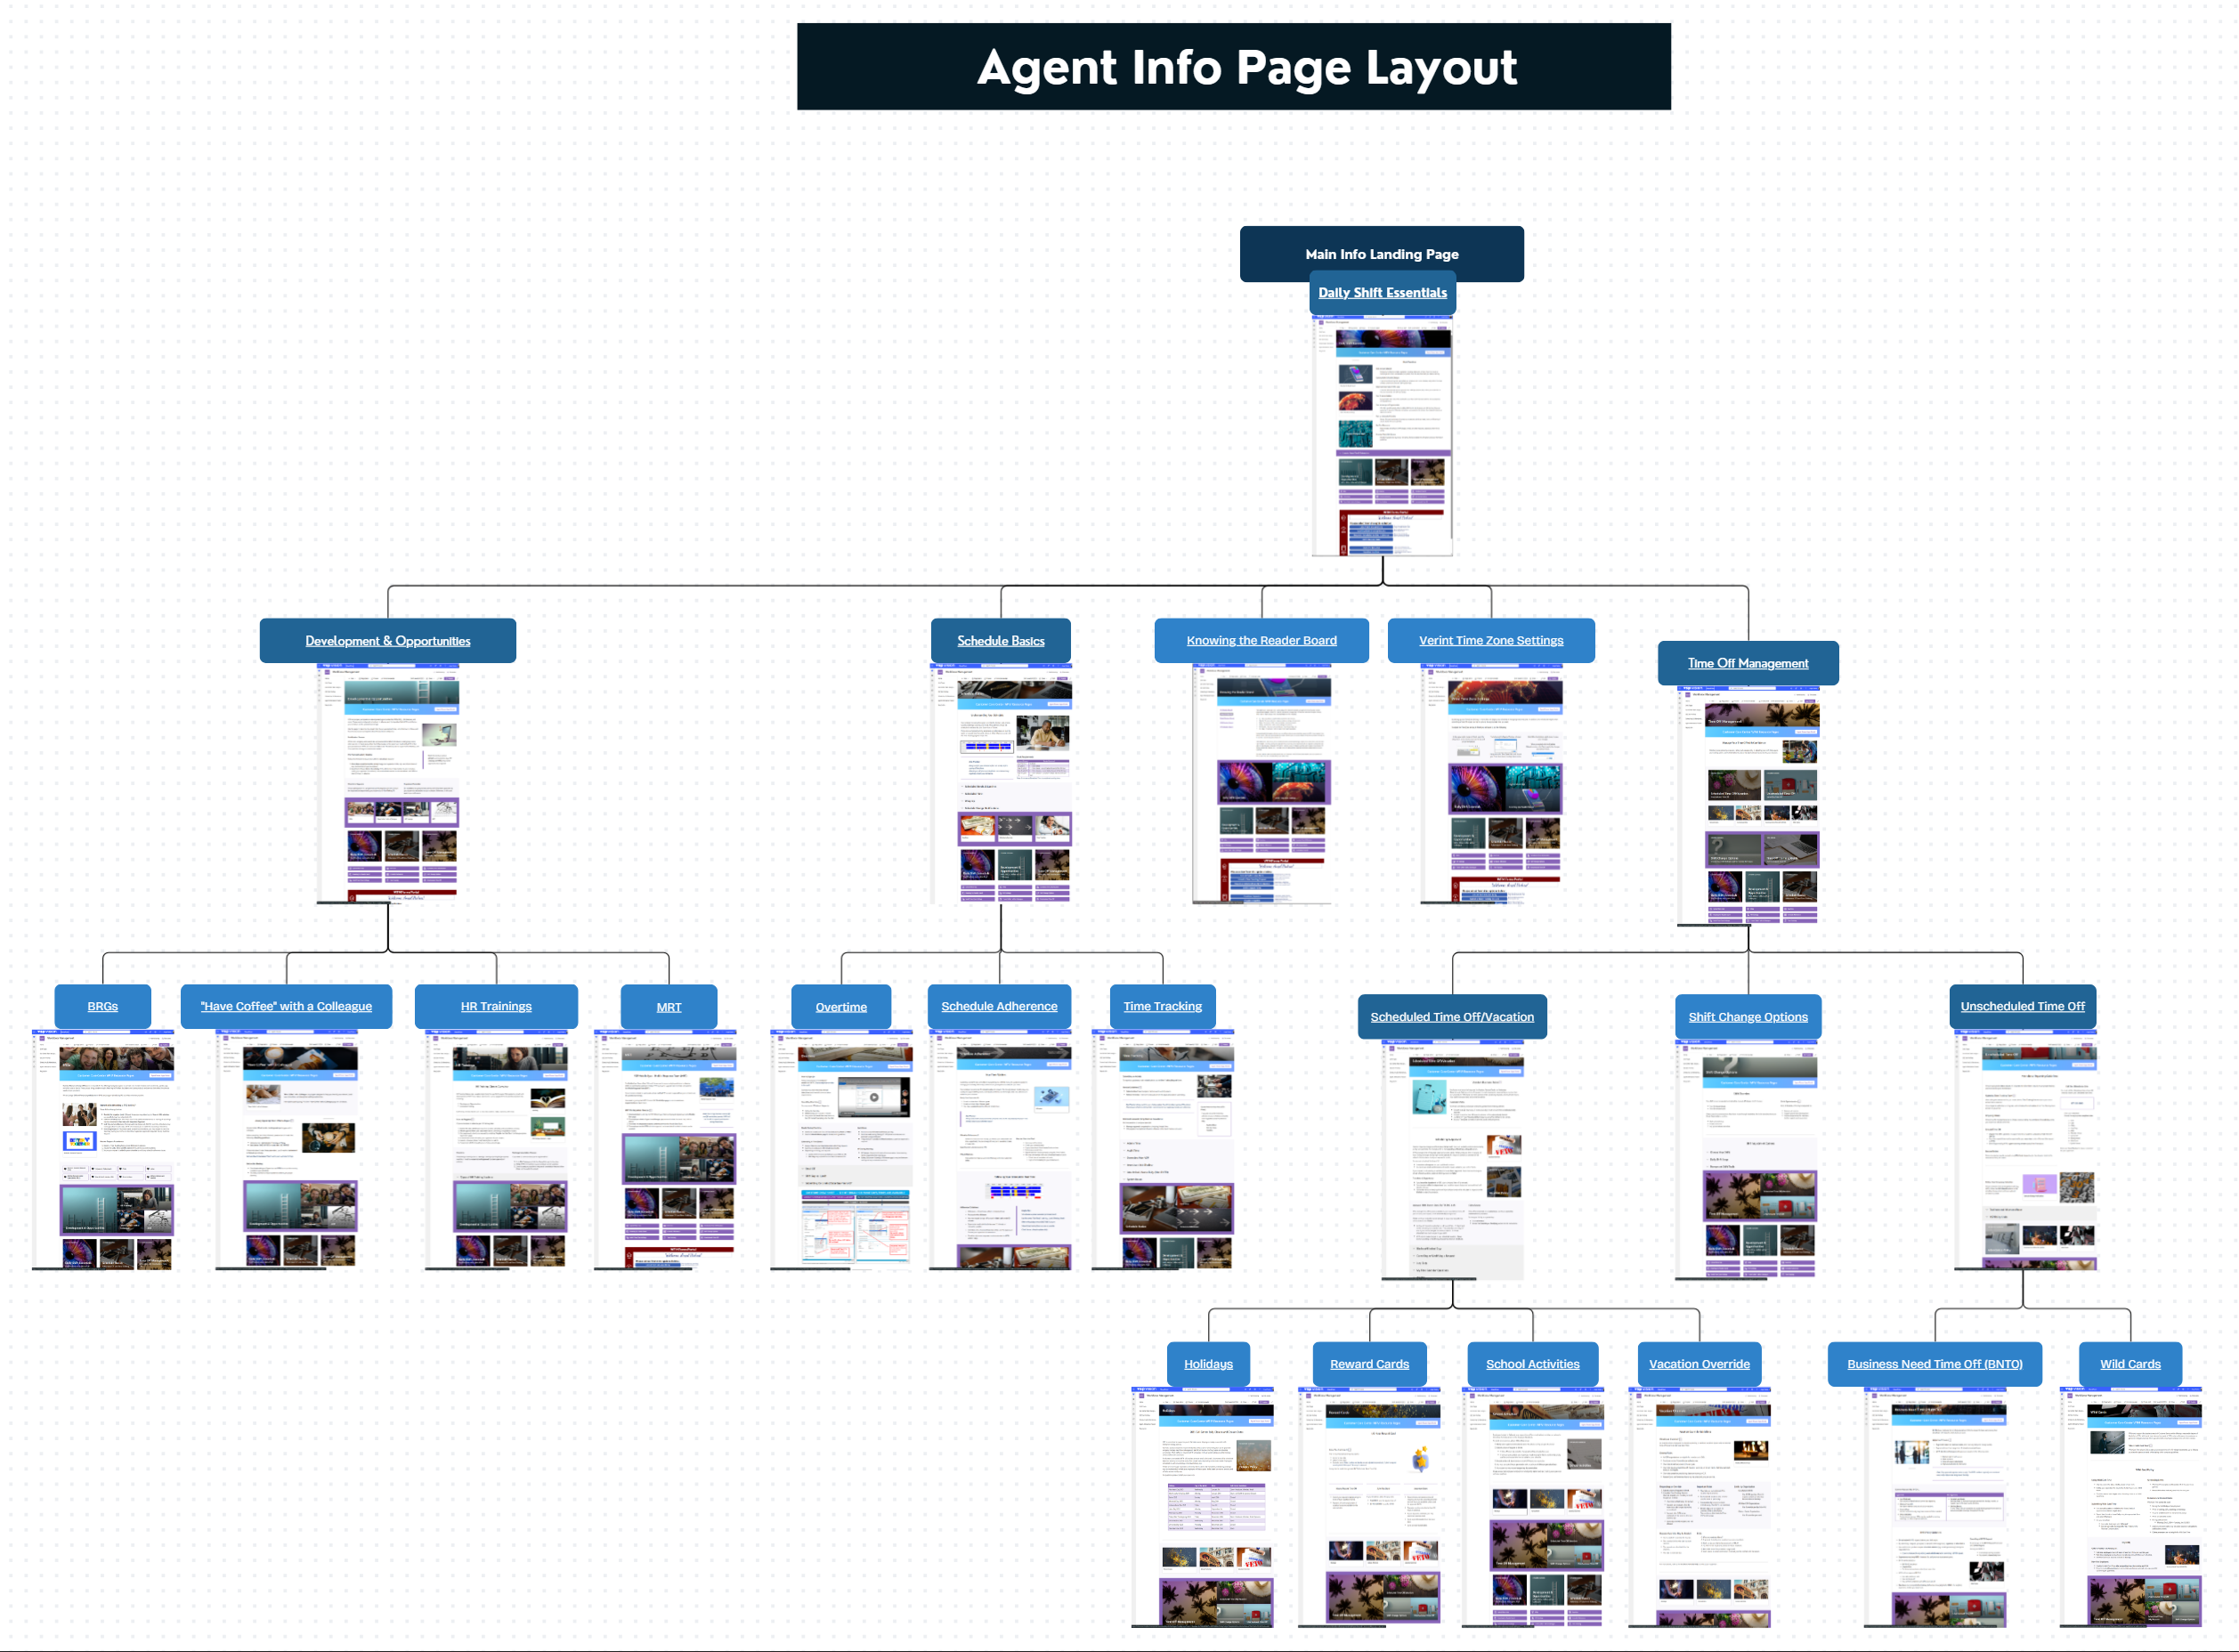
Knowledge Hub & Information Database
A 135-hour User Experience (UX) initiative focused on revamping internal resource accessibility for VSP Vision. Following an extensive audit of 130+ legacy SharePoint pages, redundant content was synthesized into a streamlined 22-page Knowledge Hub. The project involved mapping complex organizational logic into a visual information tree to ensure seamless navigation for remote agents.
SharePoint | Canva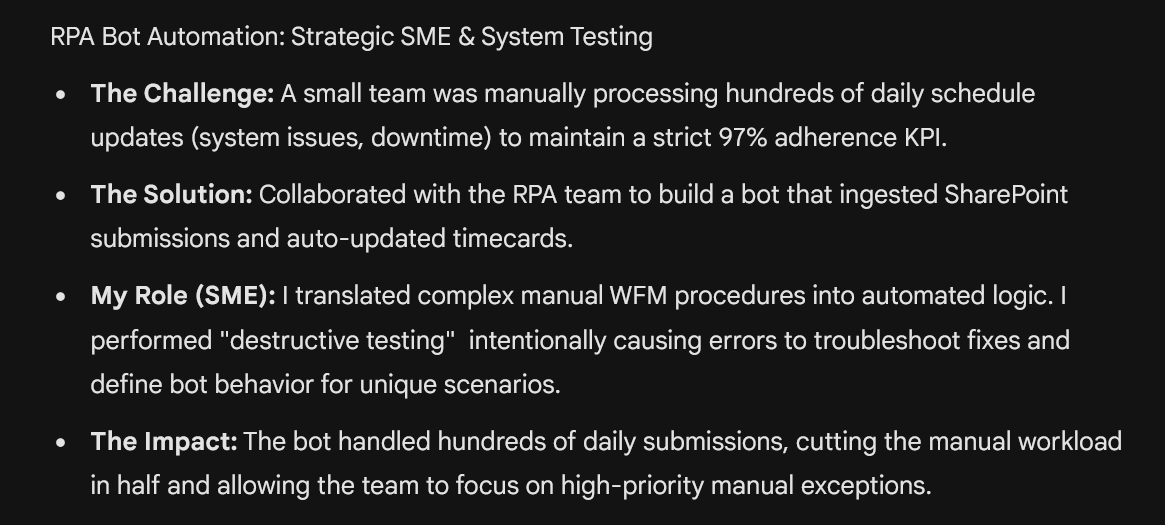
RPA Bot Automation Partnership
Strategic partnership with Robotic Process Automation (RPA) developers to automate high-volume manual timecard adjustments. Serving as the Subject Matter Expert (SME), responsibilities included defining handling logic for schedule exceptions and conducting rigorous edge-case testing. The initiative successfully reduced manual processing time by approximately 50% for the Workforce Management team.
SharePoint | Verint